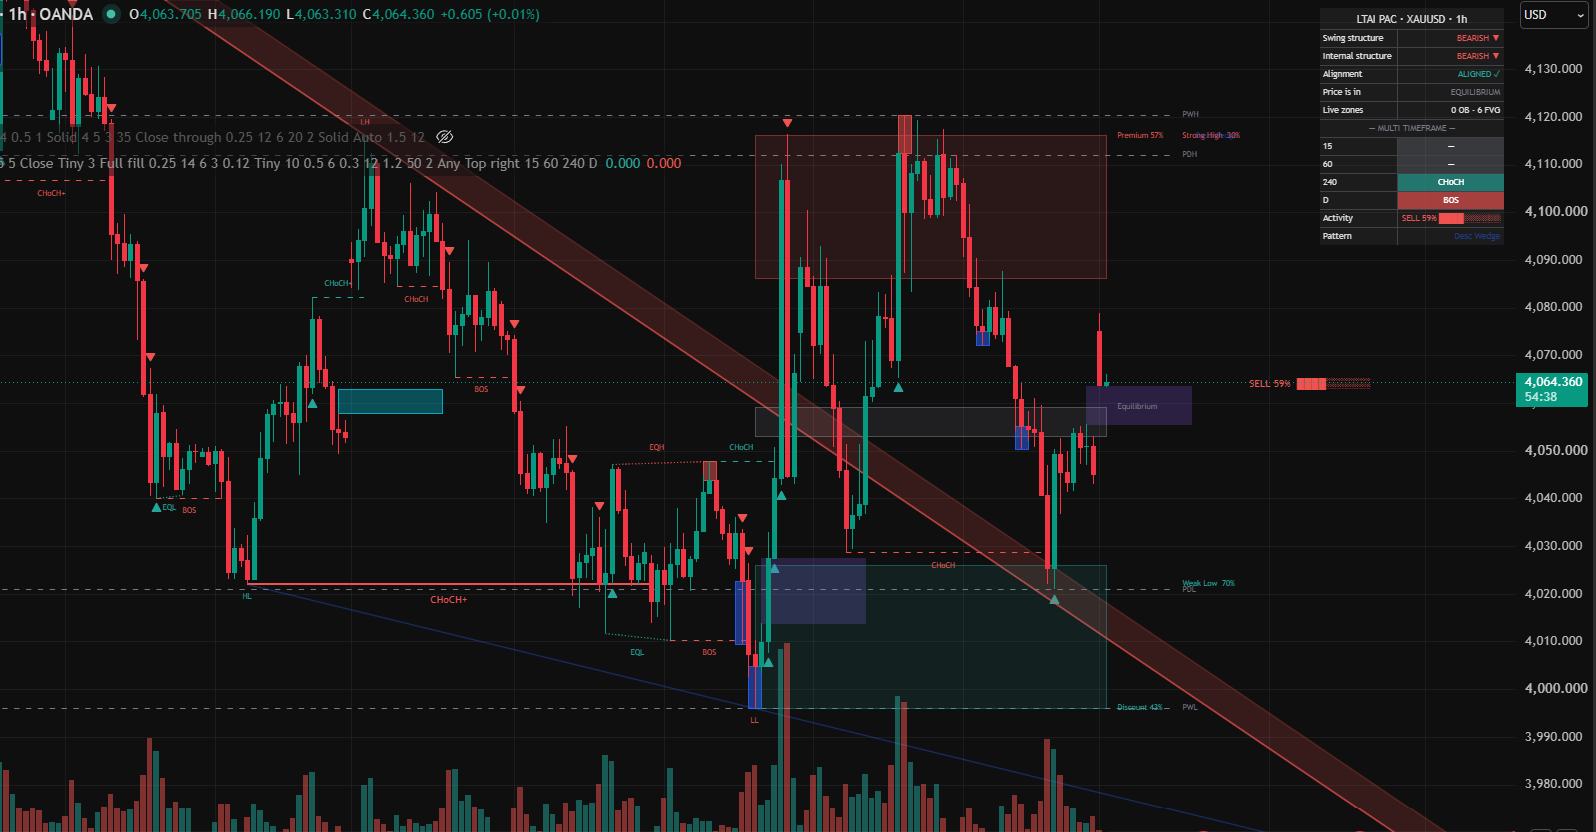
LTAI Price Action Concept reads the chart the way a smart-money trader does, and marks up every piece of it automatically — so you spend your time deciding, not drawing.
Market structure is tracked on two levels at once: internal (short-term) and swing (major). Each break is labelled BOS, CHoCH, or CHoCH+ — the "+" meaning the reversal came after price had already carved a higher low or lower high, which is the stronger version of the signal.
Order blocks are volumetric: each zone shows the volume it captured and that zone's share of all live zones, so you can see exactly where the trading happened. Zones can be invalidated by close, wick, or candle midpoint, and a broken zone is kept as a breaker because price so often respects it from the other side.
On top of that: fair value gaps (readable from a higher timeframe), balanced price ranges, liquidity grabs, equal highs and lows, trend-line liquidity zones, chart patterns, accumulation and distribution zones, premium/discount with live percentages, and previous day/Monday/week/month/quarter levels.
How to use LTAI Price Action Concept
Read the dashboard first:It shows swing trend, internal trend, and whether they AGREE or CONFLICT — plus whether price sits in premium or discount. Trade with the alignment, not against it.
Multi-timeframe scanner:Structure on 15m, 1h, 4h and 1D at a glance (all four configurable). Your entry timeframe agreeing with the higher ones is the single best filter in the tool.
Order block zones:Each block prints its captured volume and % share, so you can see where the activity was concentrated. Treat them as areas of interest, not automatic entries.
Liquidity grabs:Marks the wick when price raids a recent high or low and closes back inside. The real move often starts right after one.
Premium / discount:Look for longs in discount and shorts in premium, using the live percentage as your guide.
What's included
Internal + swing structure (BOS · CHoCH · CHoCH+)
Volumetric order blocks + breaker blocks
Fair value gaps + balanced price range (MTF)
Liquidity grabs + equal highs/lows
Trend line liquidity zones
Chart pattern detection
Premium / equilibrium / discount with %
Previous day, Monday, week, month, quarter levels
Accumulation & distribution zones
Buying vs selling activity gauge
Multi-timeframe dashboard
Alerts + custom alert builder
How access works
1 — Pay $4.99 with crypto:USDT, BTC, ETH and more. Each payment = 30 days of access.
2 — We grant your TradingView username:Added to the invite-only script within a few hours — TradingView notifies you. A free TradingView account is enough.
3 — Add it to any chart:TradingView → Indicators → Invite-only scripts → LTAI Price Action Concept.
Frequently asked questions
What is a smart money concepts (SMC) indicator?An SMC indicator marks up the chart the way an institutional-flow trader reads it: breaks of structure (BOS) and changes of character (CHoCH), order blocks where large orders were filled, fair value gaps, liquidity grabs above old highs and lows, and whether price is trading at a premium or a discount to its range.
What does CHoCH+ mean?CHoCH+ is a stronger change of character: the reversal came after price had already carved a higher low or a lower high. LTAI Price Action Concept tracks structure on two levels at once — internal (short-term) and swing (major) — and labels each break as BOS, CHoCH or CHoCH+.
What makes the order blocks "volumetric"?Each order block prints the volume it captured and that zone's percentage share of all live zones, so you can see where the trading actually happened instead of treating every box the same. Zones can be invalidated by close, wick or candle midpoint, and a broken zone is kept as a breaker because price so often respects it from the other side.
Does it work on multiple timeframes?Yes. The dashboard shows structure on 15m, 1h, 4h and 1D at once (all four configurable), plus swing trend, internal trend, whether they agree or conflict, and the live premium/discount percentage. Your entry timeframe agreeing with the higher ones is the single best filter in the tool.
How do I get access?It is $4.99 per month paid in crypto. Each payment is 30 days of access to the invite-only TradingView script — enter your TradingView username at checkout and we grant it, usually within a few hours.